INTRODUCTION
FEATURES
Chart Suites are the central document in the ProTA workflow

A simple point-and-click interface allows any element to be inspected and edited. Panels to the left and right of the charting area can be toggled to slide in and out of view as needed.

Each row in the Content Table is associated with a chart in the Chart Suite. Click or keyboard between the various charts instantly. Up to 64 columns of sortable, user-configurable information can be automatically calculated and displayed for each security.

The File Browser organizes all of the customization files applicable to the various components within the Chart Suite.
Over 100 industry-standard indicators, line studies, and plotting approaches are just the beginning.
Your analytical choices are virtually unlimited when you apply your own Custom Indicators, Trading Systems, Smartlists and Column Templates.
Drag and drop or double-click. Creating fully customized, professional analysis is easy, intuitive and empowering.

For comparative analysis, up to 25 chart views can be displayed at once in a grid. The above example shows a 1x3 arrangement. 22 unique grid options are just a click away.
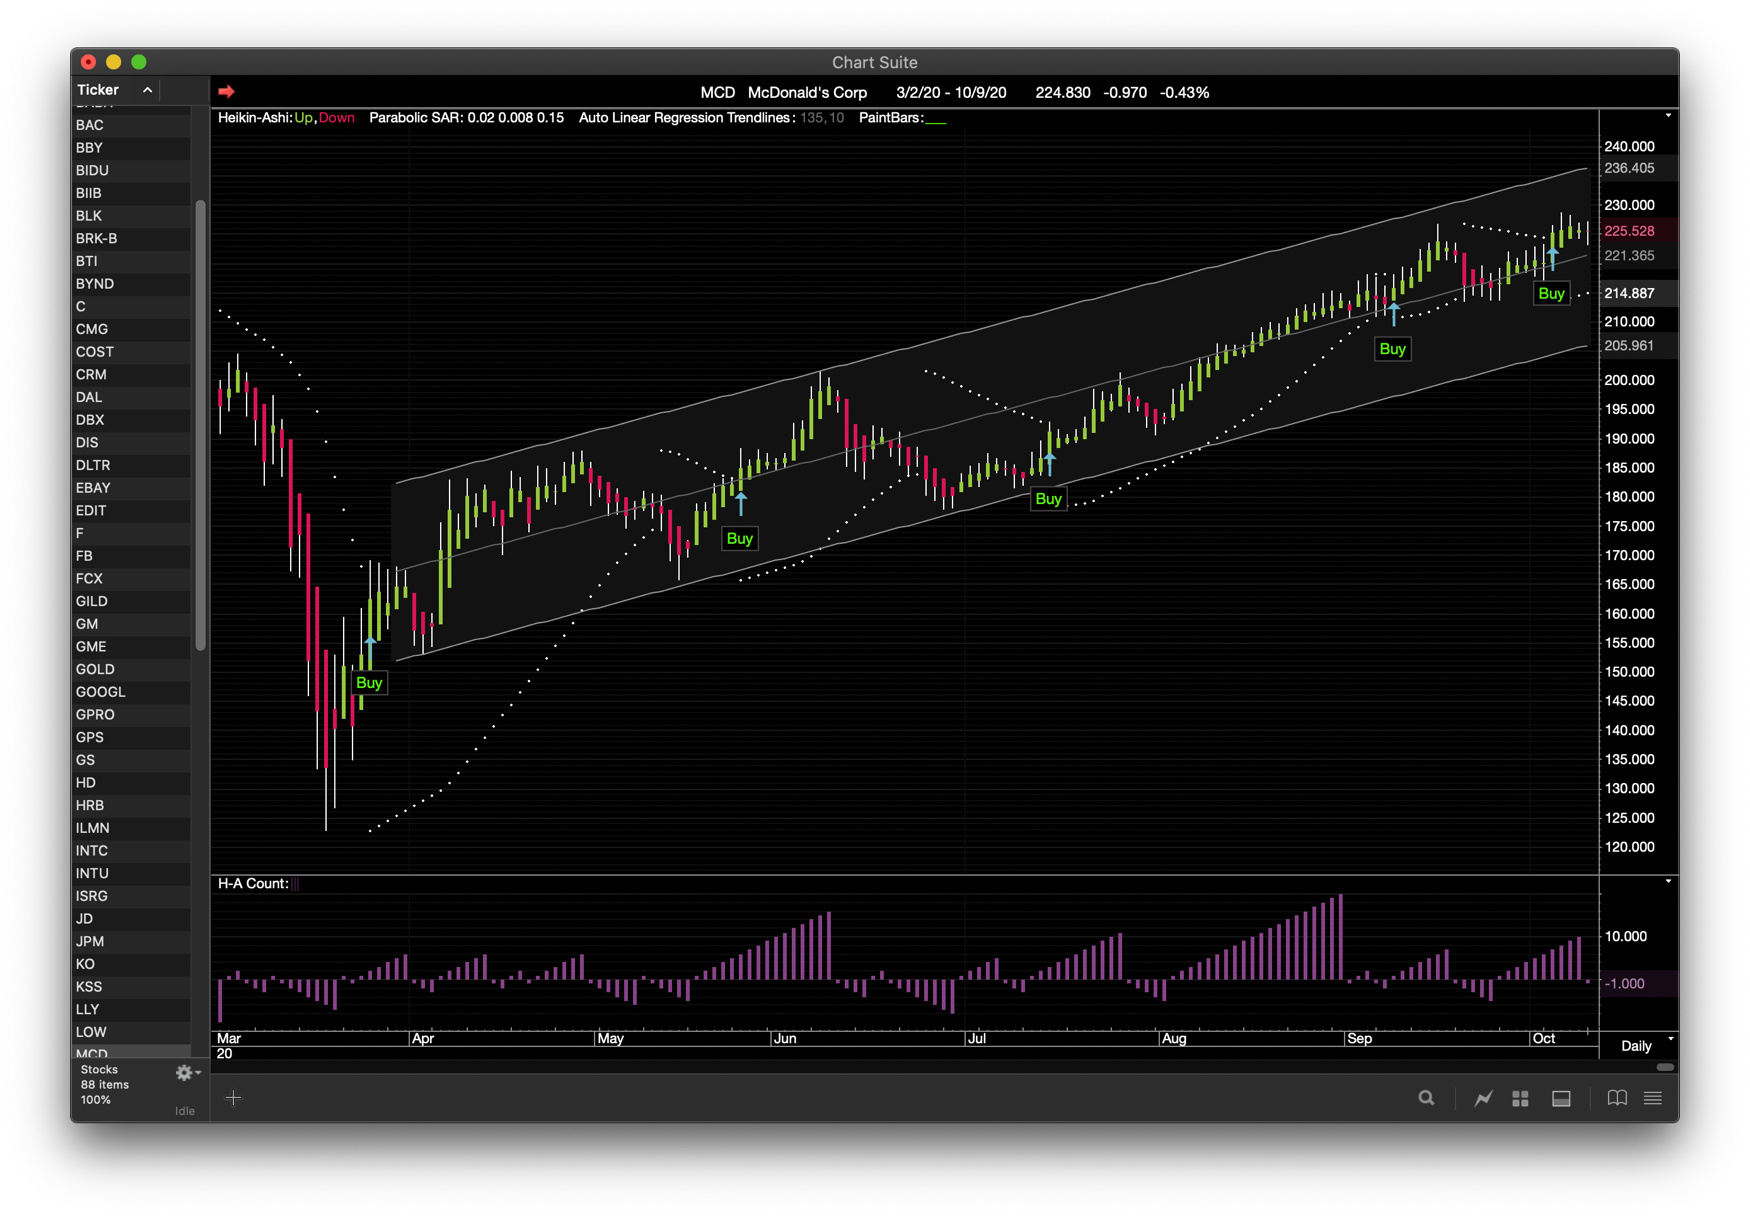
Every element of each chart is user-configurable in terms of display style, colors, analysis, and parameters. The above example shows a Dark Mode Chart Suite with a black background chart, Heikin-Ashi, Parabolics with Buy Markers, Auto Linear Regression Lines. The Browser/Inspector panel has been hidden to provide a larger charting canvas.